The Bicom Systems Status Page is officially up and running (woo-hoo!) If you are thinking, “Ah, did I miss something? What is the Bicom Systems Status Page?” take a look at our previous blog post and learn more about the idea behind it. The blog post outlines the benefits that our support team and partners will gain from utilizing the page!
If you already know about the Status Page and are wondering how to use it, keep reading.
HOW DOES IT WORK
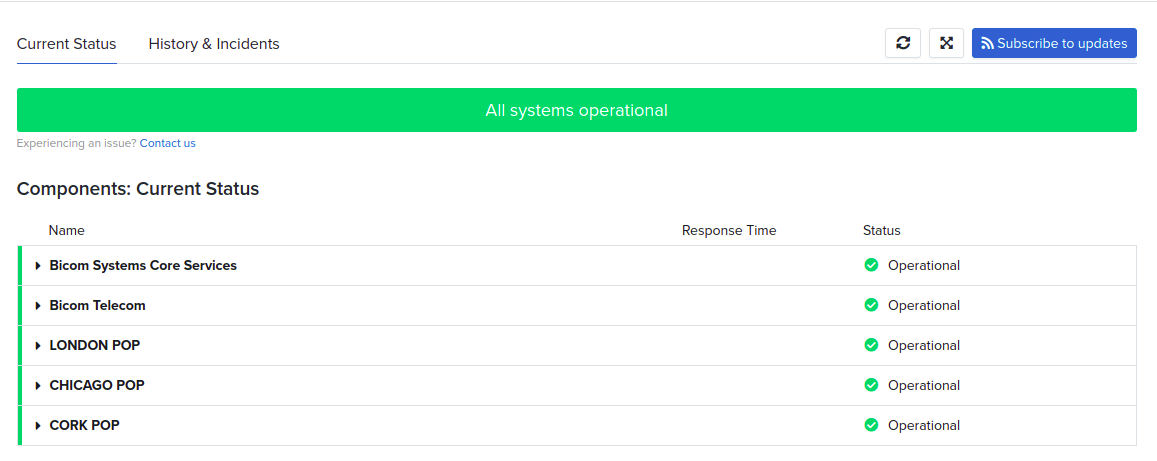
On the public Status Page, users can get information on scheduled maintenance, downtime events, and general system uptime on our services. The page will clearly state the issue, give expectations on when the matter will be resolved, and update as soon as progress is made on the internal side. The ‘Current Status’ tab pictured below shows visitors what is happening in real-time.

The components represent the various parts of our infrastructure. In the components section of the page, visitors can see the different component’s uptime. Each component is associated with checks and always displayed with its current status. System metrics are used to increase transparency with our partners and visitors by showing them real-time and historical data such as response time and uptime.

The Status Page process is automated and based on a check response. The status of components will be changed from “operational” to an assortment of statuses. Thankfully it is color-coded! We briefly explained the different colors and meanings behind them in our previous blog post, but we will review them again for clarity.
GREEN – All Systems Operational
ORANGE – Degraded Performances/Partial Outage
RED – Major Outage
GREY – Under Maintenance
 EXAMPLE
For example, if an outage occurs and a check switches to the ‘DOWN’ status, Component A is linked to Check A; therefore, it is set to automatically change to ‘Degraded Performance’ when Check A fails.
Without any human input, the update will appear on the page! The next step is for the Hosting Team to create an incident related to this outage and display it on the Status Page. Once they resolve the issue, the Status Page will update.
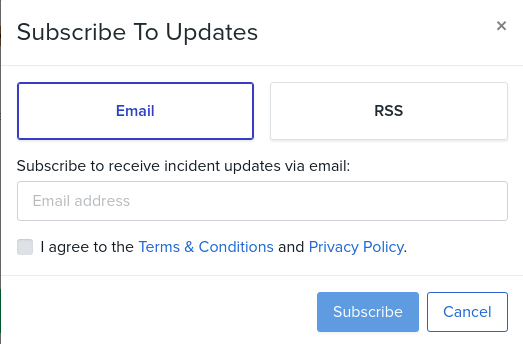
Bicom Systems Partners can subscribe to receive event incident updates via email. That way, they will be updated in real-time during the incident and can follow it through the beginning ‘investigating’ stage to the end ‘resolved’ phase.

WRAPPING UP
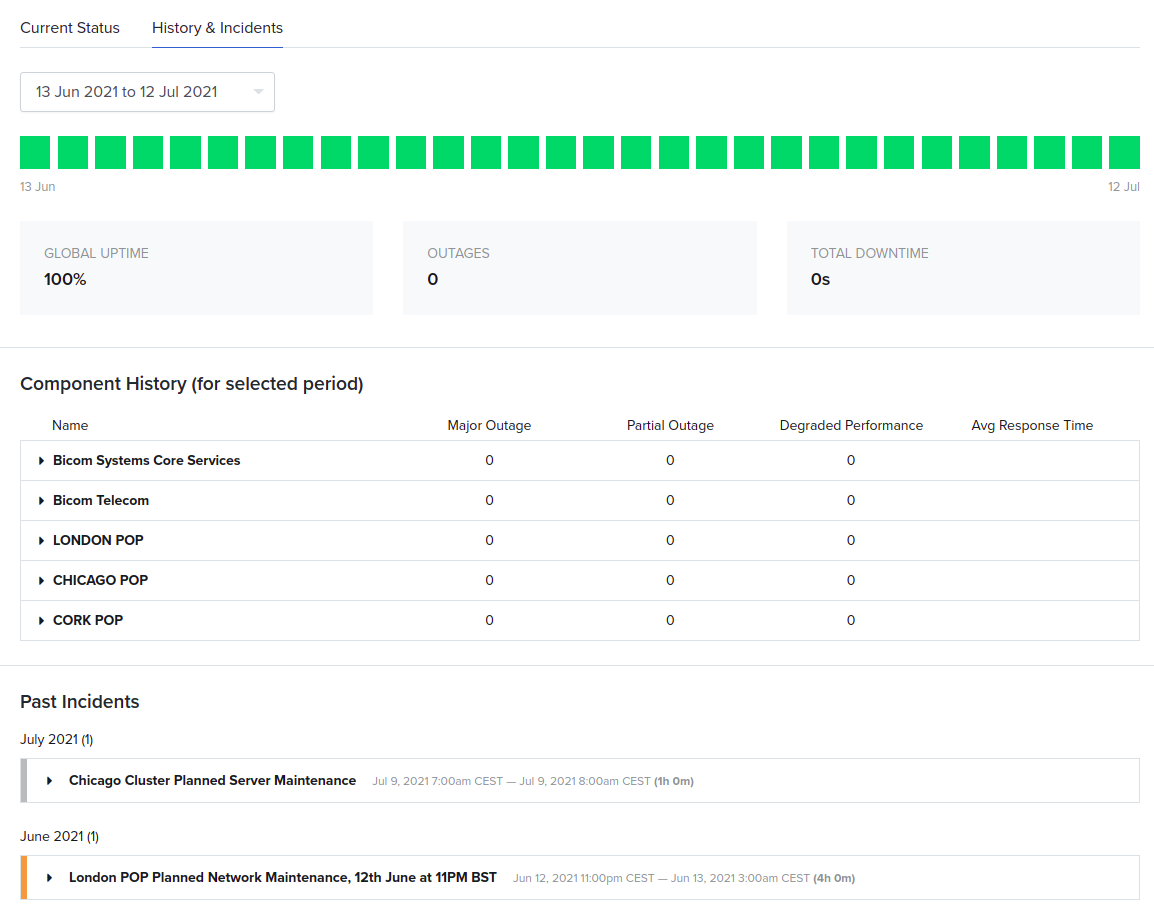
The ‘History & Incidents’ tab sums up past outages and scheduled maintenance windows. Users can browse through the previous events through a date selection and educate themselves on previous ‘downtimes’. Our Hosting team encourages our partners to review the previous data to learn how effective and efficient we are in resolving issues. Not only will it keep the team accountable, but it also provides complete transparency with partners.

Now that you understand the basics, let’s take it for a spin! Check out the Bicom Systems Status Page for yourself by visiting https://status.bicomsystems.com.
New here? Let’s Connect!
📞 +1 (647) 313 1515
📧 sales@bicomsystems.com
💻 www.bicomsystems.com/contact-us


![[Blog]-How-Does-Status-Page-Work](https://blog.bicomsystems.com/wp-content/uploads/2021/07/Blog-How-Does-Status-Page-Work-1.jpg)
